Camera test method and application
International Standard Test Card:
To determine the quality of the camera image, we need to test and evaluate the quality of the camera image, and our human eye resolution is limited. There are many evaluation parameters involved in a perfect image, such as resolution, sharpness, dynamic range, contrast, color, grayscale level, etc., so you need to use a variety of international standard test chart cards. Imatest and Applied Image, represented by Cursun Optoelectronics, can provide a variety of image test cards as well as image testing equipment and corresponding analysis software to meet a variety of testing needs, in line with international standards, to provide a variety of test chart cards for the industry. The image quality of the camera is evaluated by testing the graphics card and the corresponding image testing software to determine the quality of the camera produced by the factory.
This paper uses the QA-76 digital image resolution test card to test the imaging resolution of the camera, and explores how to accurately focus the camera according to the digital image processing theory to obtain a clearer image, which is mainly divided into two parts. The first part first selects the appropriate standard test card, collects the image and positions the center of the region of interest. The second part is to sample, process and compare the feature values ​​of the pattern to determine whether the current picture is clear. Determine the imaging resolution of the camera and select the appropriate digital image sharpness evaluation function to evaluate the corresponding features of the image under different definitions. value.
ISO12233 resolution chart card, which contains various patterns. It is not necessary to directly use the card when using it. It can also cut out the necessary parts and use them after re-splicing.
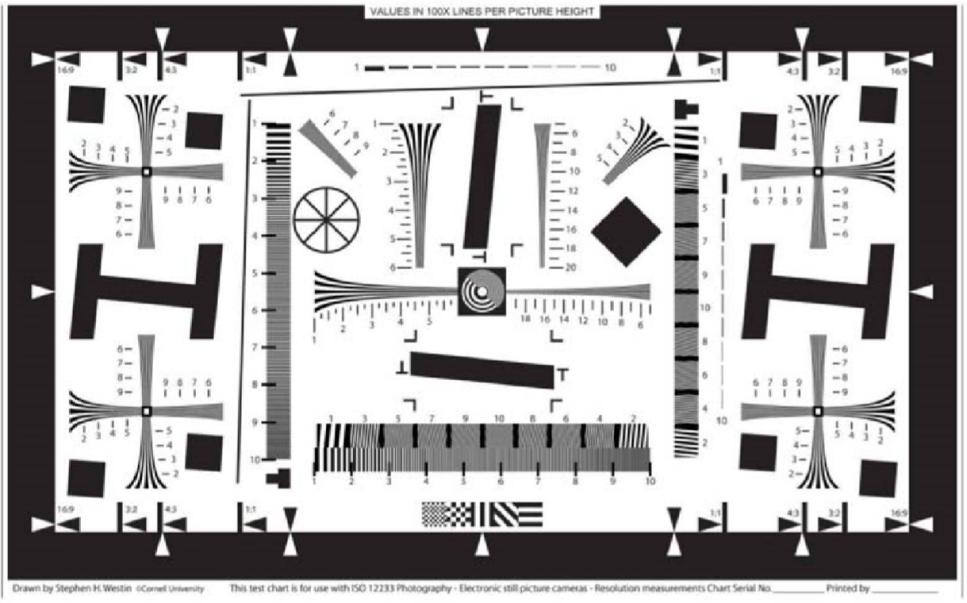
Figure 2-1 ISO12233 resolution chart
ISO12233 resolution chart card usage analysis:
1. Dark room: It can't reflect, light, turn off the light, the illumination is lower than 1Lx, and the wall is made of 18g gray gray cloth. If there is no special regulation, in order to ensure that the camera can output enough signals when shooting the test card, the surface illumination range of the test card should be between 700Lx and 1200Lx during shooting. The saturation and uniformity of the test can be adjusted according to the actual test. With the D65 source, insufficient light intensity requires the same source to fill the light.
2. Under the color temperature of D65 light source, the illumination at any point on the test chart is not more than 10% compared with the center of the test chart; at other color temperatures, the difference between the illumination at any point on the test chart and the center of the test chart is not greater than 30%, the light source should take the necessary shading measures to prevent the light source from directly touching the lens. The test chart should be surrounded by low illumination to reduce glare. Try to avoid external light when testing. The background of the test chart is black or light-absorbing neutral gray.
3. The following standard color temperatures can be used in the test: D65 light source color temperature 6500K, floodlight color temperature 3400K. The standard deviation of the color temperature of the actual test environment should be no more than 200K, and the color temperature can be changed from 2700k-7500k.
4. Temperature 20 ± 2 ° C, relative humidity 50 ± 20%.
5. The test distance can be adjusted as needed. The distance between the camera and the card is recommended to be 80-130cm. If the actual test exceeds the above range, it needs to be marked.
6. When shooting, let the effective height of the chart (the height of the inside of the thick frame when the horizontal long side is seen in Figure 2-1) just fill the picture, the number of the pattern x100 (multiplied by "the vertical pixel of the whole picture / the chart in the picture" The number of pixels of the effective height is calibrated.) The number of lines per unit height in the picture. It is not necessary to have the effective height to fill the entire screen when shooting, but calibration is required at this time.
7. Principle of camera condition setting: When measuring the resolution according to this standard, the camera parameters are in principle set at the factory. The settings used must be noted when making measurements using settings other than the factory settings. If there are parameters that cannot be determined according to the factory settings, the manufacturer will measure according to the settings most likely to be used by the user of the camera, and indicate the information that can be determined. The exposure conditions, focus, and zoom position are not specified; the camera's white balance must be adjusted appropriately with respect to the illumination source.
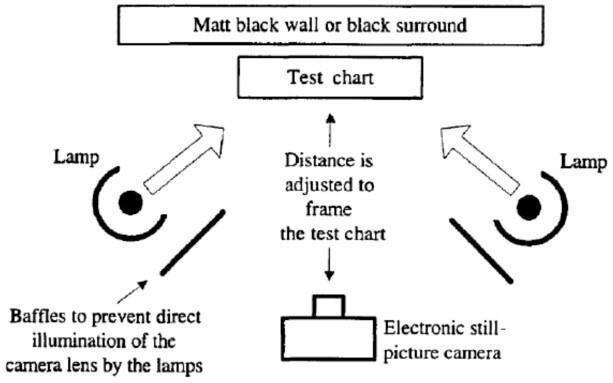
8. Test chart lighting method as shown below:
After taking the above ISO chart, the captured image is printed or displayed, and the image is visually evaluated. It can also be evaluated using software that can perform the same processing as the visual evaluation. In order to minimize the dispersion of the evaluation, the following two points are used as the evaluation criteria.
A) The spatial frequency of the number of wedge lines of the visual resolution evaluation pattern is changed (for example, from 5 to 4) as the resolution. The unit is expressed in terms of the number of bars per height in the picture.
B) Tracking starts from low frequency when observing.
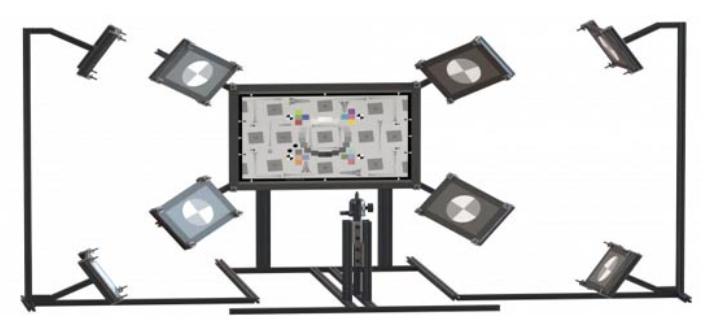
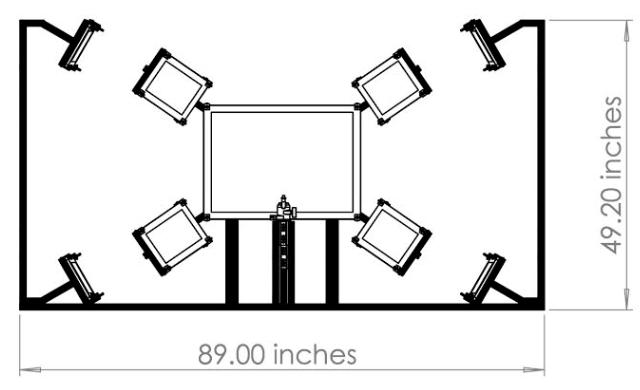
The image test equipment of Gurun Optoelectronics is as follows:
Sharpness algorithm based on quadratic fuzzy
If an image is blurred, then it is blurred again, and the high-frequency component does not change much; if the original image is clear, and it is blurred once, the high-frequency component changes very much. Therefore, a Gaussian blurring process can be performed on the image to be evaluated to obtain a degraded image of the image, and then the change of the adjacent pixel values ​​of the original image and the degraded image (the image after the blurring) is compared, and the definition is determined according to the size of the change. The lower the calculation result, the clearer the image, and the more blurred it is. This idea can be called a quadratic blur-based sharpness algorithm, and its simplified process is shown in Figure 3-4.
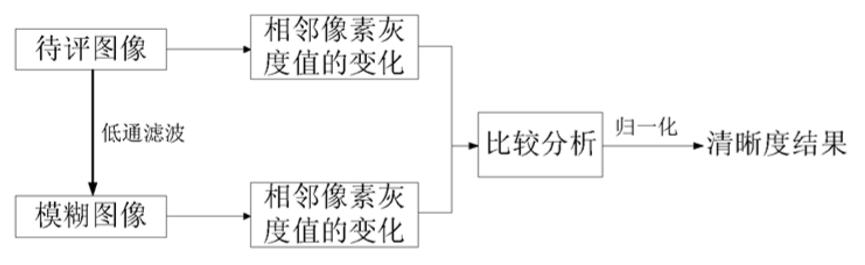
Figure 3-4 Flow chart of the secondary fuzzy definition algorithm
Evaluation based on region of interest
The experimental test pattern used in this paper is composed of a plurality of circular regions with different orientations. Considering the different resolutions of different orientations such as the focus center and the image around the camera when shooting images, the test card with multiple orientations of circular regions is selected. The detection is performed, and then the definition of the overall image is balanced.
The overall process of test evaluation is shown in Figure 3-5:

Figure 3-5 Overall process based on the resolution of the region of interest
According to the camera focusing requirements, the definition of the central stripe sharpness is introduced. Here, the center of the center stripe center should be positioned first. Compared with the center of the circular area around the two sides, the center stripe has a narrow center-high brightness ring band. When the center of the circular area on both sides is detected, if the center of the center stripe is not effectively positioned, the coordinates of the center of the center stripe area are determined according to the symmetrical isometric characteristics of the figure.
After determining the coordinates of the center of the center stripe, set the stripe area detection frame, and scan the pixels of each point of the stripe from the upper left corner of the detection block diagram, find the variance value of each pixel and its laterally adjacent pixels, and accumulate the overall square. Pixel variance and . At the same time, the overall gray level of the pixels in the detection frame is calculated as the background brightness value. The overall variance and the overall grayscale and the division are obtained to obtain the overall grayscale variation ratio value, multiplied by a certain coefficient and scaled to within 100, so that the circular region evaluation values ​​are compared and merged.
After obtaining the central stripe region sharpness evaluation value, the circular region evaluation value is integrated with a certain ratio of weights to obtain an adjusted evaluation graph.
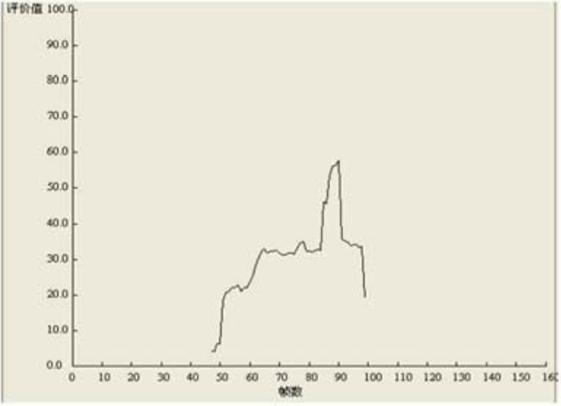
The following is the corresponding evaluation curve from blur to clear to blur in the camera focusing process.
Biotechnology,Tebuthiuron,Trifloxystrobin,Flufenacet,Amicarbazone,Prothioconazole,Sulfentrazone
Changzhou Satidi Import and Export Co., Ltd. , https://www.guanjiejts.com