I. Brief introduction of pharmacokinetics
Pharmacokinetics is a science that studies the regularity of the drug's content in animals over time and is a pharmacological one. The process of absorption, distribution, metabolism and excretion of drugs in the body is studied. It can be used in many scientific fields such as drug treatment, clinical pharmacology, molecular pharmacology, biochemistry, biological agents, analytical chemistry, pharmaceuticals, pharmacology and toxicology. It has played a major role in guiding new drug design, optimizing dosage regimens, improving dosage, and providing high-efficiency, fast-acting (or sustained-release), low-toxic (or low-side) pharmaceutical preparations.
Second, the tools needed for pharmacokinetic studies
1. Micro PET/CT
Simultaneously, the drug-making and collection are carried out simultaneously, that is, while collecting and collecting, the whole process of monitoring the drug in the receptor metabolism process is the most effective expression of the value of the small animal PET/CT device in the pre-clinical drug development process.
Super Nova® PET/CT equipment supports the collection and reconstruction of dynamic PET images required for pharmacokinetics, allowing the drug to be distributed and metabolized in the body as soon as the drug is injected into the animal. The physiological and biochemical processes in the living tissue are quantitatively analyzed to make a forward-looking judgment on the dose, the site of action, and the possible side effects.
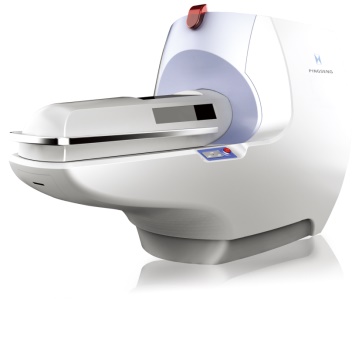
Micro PET/CT - Super Nova® PET/CT (Life Health)
After Eg1. <br> mouse systemic metabolic imaging of mice intravenously injected 18 F-labeled FDG, using Super Nova® PET / CT (a lifetime medical) dynamic data acquisition and reconstruction can be observed in 1 second to 1 hour Distribution of distribution in 18 F-FDG mice.
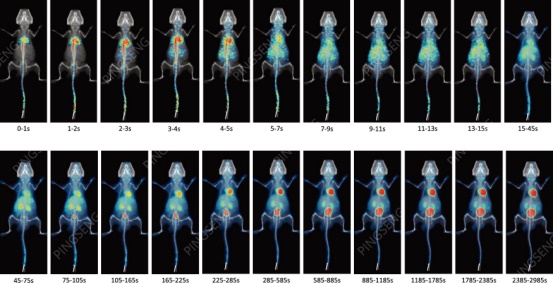
Figure 1. Dynamic PET/CT image (seconds) within 1 hour after injection of FDG
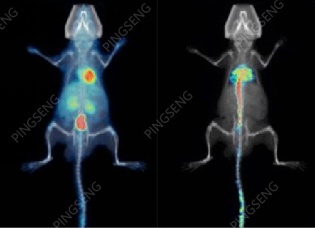
Figure 2. Mouse systemic drug metabolism display
Eg2. Distribution and metabolism of different tissues and organs <br> Quantitative analysis of ROI in different tissue regions of the above dynamic data can obtain the distribution and metabolism of 18F-FDG in various tissues and organs after entering the mouse, and obtain normal small Time activity curve (TAC) of murine tissue organ metabolism of the drug.
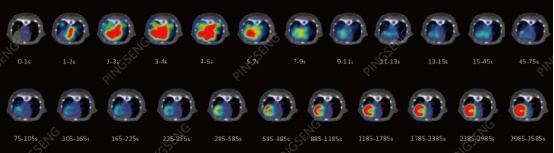
Figure 3. Dynamic imaging of cardiac metabolism
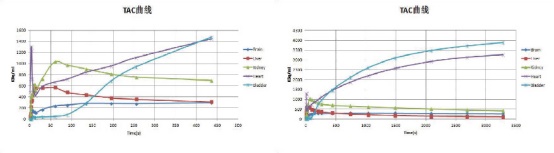
Figure 4. TAC of tissue organs within 1 minute . Figure 5. TAC of tissue organs within 1 hour.
2. Professional image analysis software PMOD
PMOD software has powerful and comprehensive features:
(1) Drug metabolism study Analyzes the whole process of absorption, retention, and metabolism of drugs. The correlation between different tissues and organs is quantified by parameters K1, K2, etc. and displayed in images with different colors.
(2) Whole body tissues and organ models The heart, brain, and visceral models are automatically compared with the model when image processing and data analysis.
(3) Images of human and small animals The relevant data of rats, mice and human bodies are automatically compared with data and model applied.
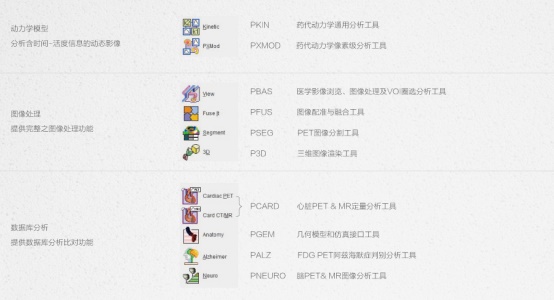
(4) Fully meet all the functions of medical image analysis (as shown in the following table):
Eg.3 TAC in the brain region of mice
In the following experiment, normal mice were injected with 18 F-Fallypride, followed by dynamic scanning and dynamic reconstruction with Super Nova® PET/CT (Rehabilitation). The reconstructed images were zonalized using the PFD PFUS module. It can outline different brain regions such as cerebellum, hypothalamus and hippocampus.

Figure 6. Partial map of normal mouse brain
Quantitative calculations were performed on the brain partitions in different time slices, and the TAC curve of the brain core keratin dose as a function of time was plotted, as shown in the following figure.
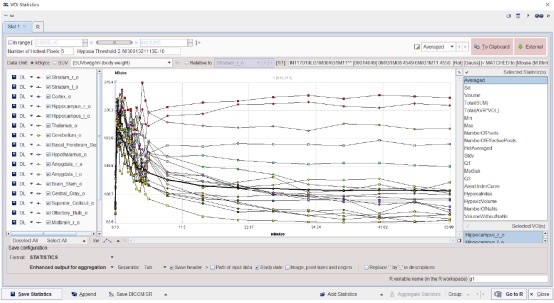
Figure 7. TAC curve of brain partition
3. Blood activity analyzer Twilite
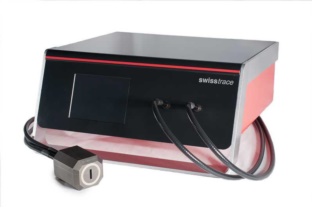
Figure 8, device shape
• Function: Suitable for real-time measurement of pharmacokinetic blood activity • Subject: small experimental animals to larger individuals (including humans)
• Principle: By measuring the arterial input function (AIF), combined with the data images obtained by PET, using PMOD software for dynamic modeling and image analysis, the metabolism of radioactive substances in the experimental body is obtained.
• Application: The determination of various parameters in pharmacokinetics is of great significance, and has important guiding significance for clinical drug evaluation and drug efficacy evaluation.
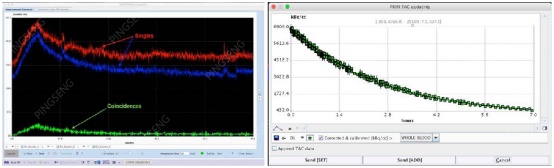
Figure 9, data acquisition demonstration (left), data analysis demonstration (right)
Note: Pingsheng Company is the general agent of China for this product.
3. Model analysis in pharmacokinetics<br> Further, pharmacokinetics can analyze the dynamics of drugs in vivo through two factors: “rate type†and “mathematical model and compartmentâ€.
In order to quantitatively analyze the kinetics of drugs in the body, the compartment model is usually used to simulate the human body or the organism, and the human body or the living body is divided into several compartments. As long as the transport rate of some parts of the body is the same, it can be classified into one compartment. The division of the atrioventricular is independent of anatomical location or physiological function.
In the case where the compartment model is not applicable, other models have been proposed, such as a graphical model (Graphical model, Graphical plot) and a pixel-level pharmacodynamic modeling (Pixel wise kinetic modeling).
Establishing the right model is crucial in the pharmacokinetic study.
An example of Eg.4 compartmental model analysis <br> The dynamic experimental results of 18F-Fallypride injection in normal mice are still analyzed, and the cerebellum of the mouse is used as a reference tissue, and the striatum of the mouse is used as a room. For the study subjects, the Simplified Reference Tissue Model was used as the compartmental model of pharmacokinetics. The PKIN PKIN was used to analyze the pharmacokinetic profile of the striatum, as shown in the following figure. BPnd indicates that the drug reached equilibrium after being in the tissue. The concentration ratio of the body-bound drug to the drug not bound to the receptor.
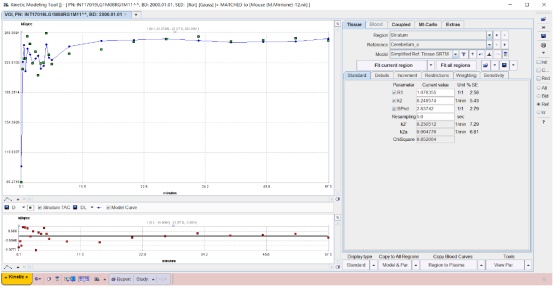
Figure 10. Pharmacokinetic curves of the striatum
Fourth, Micro PET / CT used as a summary
Micro PET/CT is a quantitative nuclear medicine imaging tool that provides a non-invasive method for studying pharmacokinetics. The curve of drug concentration in each organ can be measured in time in the PET image, and thus the process of absorption, distribution, metabolism, excretion, and the like of the drug in vivo can be observed dynamically and quantitatively from the molecular level. It can be observed whether the drug crosses the blood-brain barrier, whether there is organ-specific aggregation, whether the target receptor is recognized, and the ratio of drug content in plasma to tissue, and the physiological and biochemical processes of the animal and the effects of various drugs on the disease process are monitored. Therefore, Micro PET/CT is an indispensable tool in the pre-clinical field.
Changzhou Ziying Metal Products Co., Ltd , https://www.ziyingmetal.com